


Prefer the print book? Buy on Amazon
As an Amazon Associate, Sumizeit earns from qualifying purchases.
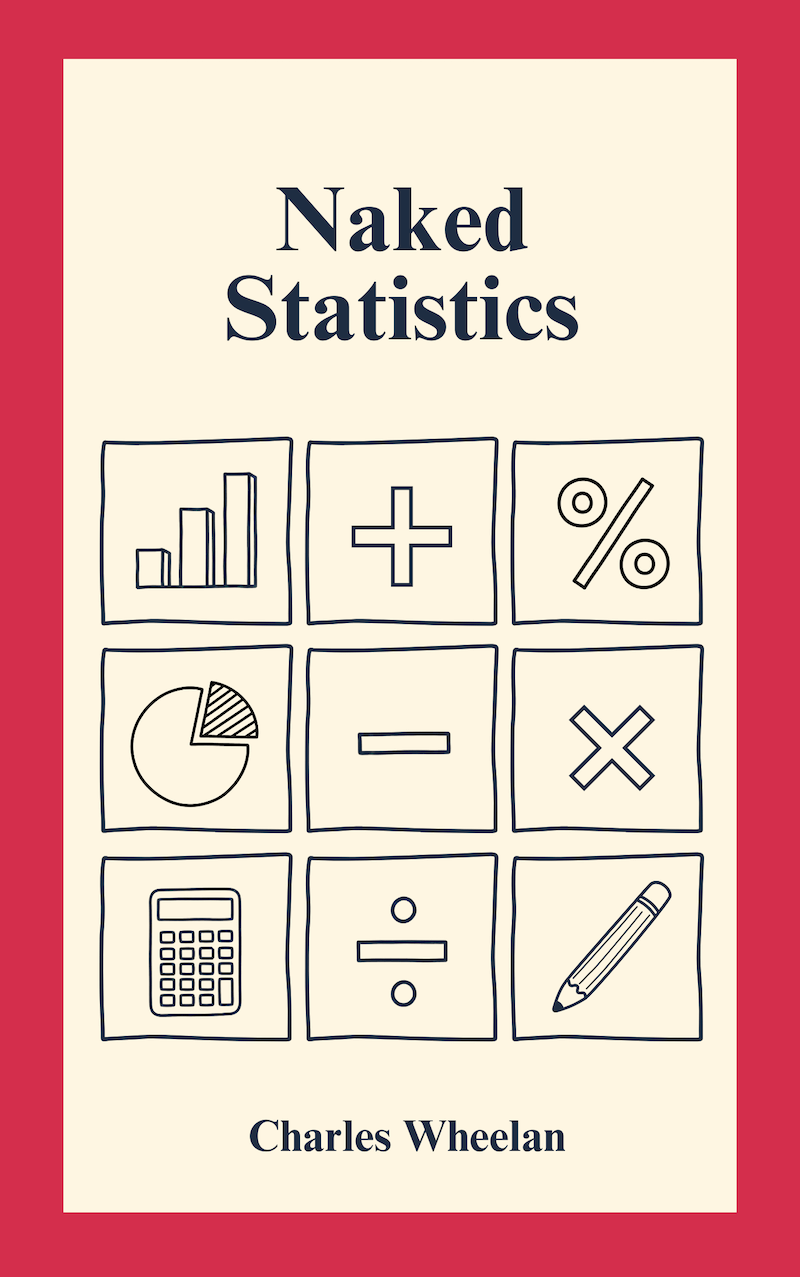
Naked Statistics Book Summary
This Naked Statistics Book Summary covers the key ideas, lessons, and takeaways in about 20 minutes.
Short Description:
Naked Statistics shows statistics empower understanding and rational decisions.
Helps with these goals
Want the complete 20-minute summary?
- Full structured summary
- Video Summary
- Podcast Summary
- Audio summary
- Key takeaways
- Exercises
- Quiz
- Highlights and notes
- Ask the book with AI
Want a Free Weekly Read?
Get a free summary every week straight to your mailbox.
Preview the Naked Statistics book summary
Below is a preview of Sumizeit’s comprehensive human-written summary of Naked Statistics by Charles Wheelan. The full summary is 15-20 minutes long and covers the book’s key ideas in text, audio, visual, and video formats. Unlock the full 20 Minute Summary
Wheelan emphasizes that statistics is the backbone of decision-making in modern society—shaping everything from medical diagnosis to online advertising, from public policy to sports strategy. He stresses that most people unknowingly rely on statistical models every day: Google autocomplete uses probabilities to predict what you’ll type next; Spotify recommends music based on statistical similarity to your past behavior; Amazon decides which products to display based on click-through probabilities; and hospitals determine staffing needs by analyzing seasonal patient surges. Companies like UPS and FedEx use statistical route-optimization models to reduce fuel use. Airlines forecast overbooking probabilities to avoid empty seats. Political analysts interpret polling data to project elections, adjusting for likely voter models and sampling biases. Wheelan underscores that even life-critical systems—such as early cancer detection, emergency room triage algorithms, and self-driving cars—are built entirely on statistical probability. He argues that understanding these ideas is crucial not only to avoid being misled but to meaningfully engage in modern society, where nearly every important argument involves data.
Turning Raw Numbers Into Useful Stories
Wheelan explains descriptive statistics by showing how they compress massive datasets into simple, interpretable summaries. He gives examples such as:
• E-commerce: Amazon tracks every click, search, and purchase from millions of shoppers but summarizes performance through conversion rates, average order value, and customer lifetime value.
• Weather forecasting: Meteorologists use 30 years of weather data to calculate average temperatures, rainfall distributions, extreme-value probabilities, and climate trends.
• Public health: Agencies summarize flu outbreaks using positivity rates, reproduction numbers, and median ages of infection.
• Sports: Basketball teams analyze tens of thousands of possessions to produce averages like points per possession, effective field-goal percentage, and player efficiency rating (PER).
He also explains why variability matters as much as central tendency. Consider two investment portfolios: both average a 7% annual return, but one swings from –20% to +30% while the other stays between +5% and +9%. The second portfolio is far safer. Wheelan uses the example of airline arrival times: the average delay might be 10 minutes, but if some flights are delayed two hours, passengers suffer more than that average suggests. Standard deviation uncovers the hidden volatility behind simple averages. He also uses box plots to show income dispersion across neighborhoods and scatterplots to illustrate how studying hours relate to exam scores. These examples teach readers that describing a dataset requires more than just one number—it's about understanding its shape, spread, and extremes.
When “The Average” Misleads
Wheelan elaborates on how reliance on averages leads to flawed systems. He cites: • Urban planning: City planners often use “average commuting time” even though traffic peaks are driven by outliers—massive congestion events—not typical days. • Healthcare diagnostics: “Average” blood glucose levels ignore patients whose highs and lows average out to normal but whose swings are dangerous. • Economic policy: Policymakers looking at average wage growth overlook the fact that most wage gains may go to the top 10%, hiding stagnation for the majority.
Want the complete 20-minute summary?
- Full structured summary
- Video Summary
- Podcast Summary
- Audio summary
- Key takeaways
- Exercises
- Quiz
- Highlights and notes
- Ask the book with AI
Who should read Naked Statistics?
Naked Statistics is for anyone who wants to understand how data shapes decisions in modern life—from voters interpreting election polls to employees analyzing job offers to consumers evaluating health claims. Whether you're a business professional, student, or engaged citizen, this book teaches you to recognize statistical thinking in everything from marketing claims to medical diagnoses, without requiring advanced math skills.
Why does Naked Statistics matter?
In today's data-driven world, statistical literacy is essential for avoiding manipulation and making informed decisions. Charles Wheelan shows how statistics underpin critical systems—from healthcare diagnostics to AI algorithms to public policy—making it vital to understand both the power and the pitfalls of data. Without this knowledge, you're vulnerable to misleading headlines, biased studies, and false correlations that affect your wallet, health, and vote.
What are the key themes in Naked Statistics?
- Beyond averages: why distributions and variability matter more than single numbers
- Correlation versus causation: how to avoid false assumptions about relationships
- Data quality as foundation: garbage in, garbage out
- Probability and uncertainty: navigating real-world decisions with incomplete information
- Statistical manipulation: how numbers are weaponized in marketing, politics, and media
- Regression thinking: isolating true causes amid competing factors
- Randomized trials and experiments: the gold standard for testing what actually works
Want the complete 20-minute summary?
- Full structured summary
- Video Summary
- Podcast Summary
- Audio summary
- Key takeaways
- Exercises
- Quiz
- Highlights and notes
- Ask the book with AI
How can you apply ideas from Naked Statistics?
- Audit business metrics by calculating median, mode, and range alongside averages to spot whether power users or outliers distort your performance picture
- Design A/B tests using statistical confidence intervals rather than early wins, preventing false positives from inflating expected improvements
- Evaluate job offers by calculating expected value (salary × probability of keeping job + benefits × likelihood) instead of accepting surface numbers
- Interrogate news and marketing claims by asking for sample size, time frame, baseline, and whether absolute numbers match percentages
- Build personal investment or business forecasts using distributions (best-case, worst-case, likely) and standard deviation to plan for volatility, not just expected return
- Assess insurance decisions (health, auto, property) by computing expected cost of risk (probability × financial impact) versus premium to avoid overpaying for low-probability disasters
- Identify confounding variables in hiring, product decisions, or partnerships by listing all plausible alternative explanations before assuming correlation equals causation
What common mistakes do readers make with Naked Statistics?
- Trusting an average without examining distribution: a median income of $50k and mean of $70k signals right-skewed inequality, not a typical household
- Assuming correlation implies causation: obesity and life expectancy correlate, but socioeconomic status and healthcare access are the real drivers
- Ignoring sample bias: election polls that underweight rural voters or underrepresent younger voters systematically miss outcomes
- Accepting statistics without checking the source: percentages without context, vanity metrics without definition, or claims traced to vested interests rather than independent research
Sumizeit Exercises Apply what you've learned
Turn ideas from Naked Statistics into action with a short guided reflection: identify the biggest takeaway, connect it to your life, and commit to one step you can take in the next 24 hours.
What is the expert analysis of Naked Statistics?
Overview
Naked Statistics by Charles Wheelan stands as a pivotal work in demystifying the often intimidating field of statistics for a broad audience. Wheelan, an accomplished economist and Dartmouth lecturer, leverages his dual expertise in academia and journalism to craft an accessible yet intellectually rigorous narrative. The book’s significance lies in its ability to translate complex statistical concepts into practical insights that resonate across disciplines—from public policy and healthcare to business analytics and everyday decision-making. By framing statistics as an indispensable language of modern life, Wheelan elevates statistical literacy from a niche academic skill to a vital civic competency.
Core Thesis
At its core, Naked Statistics argues that statistical thinking is essential for navigating an increasingly data-driven world. Wheelan contends that understanding statistics is not merely about mastering formulas but about cultivating a mindset that critically evaluates data, questions simplistic interpretations like averages, distinguishes correlation from causation, and recognizes the inherent uncertainty in probabilistic reasoning. This literacy empowers individuals to avoid manipulation, make informed decisions, and engage meaningfully in societal debates shaped by data. Statistics, therefore, is presented as a practical toolkit and a public good, foundational to both personal agency and democratic discourse.
Strengths
- Clarity and Accessibility: Wheelan excels at breaking down abstract statistical concepts into relatable, real-world examples, making the material approachable without sacrificing depth.
- Interdisciplinary Relevance: The book’s wide-ranging applications—from healthcare diagnostics to sports analytics and public policy—demonstrate statistics’ pervasive influence and practical utility.
- Critical Thinking Emphasis: Rather than rote computation, Wheelan emphasizes skepticism, data quality assessment, and the interpretation of statistical results, fostering a nuanced understanding.
- Engaging Anecdotes and Paradoxes: The inclusion of famous fallacies and paradoxes (e.g., Simpson’s Paradox, Prosecutor’s Fallacy) enriches the narrative and highlights common pitfalls in data interpretation.
- Actionable Guidance: The implementation guide offers concrete steps and reflective exercises, bridging theory with practice and encouraging readers to internalize statistical habits.
Critiques & Counterarguments
- Potential Oversimplification: While accessibility is a strength, some critics may argue that the book occasionally glosses over the mathematical rigor and complexity underlying statistical methods, which could mislead readers about the challenges of proper application.
- Limited Engagement with Advanced Topics: The treatment of regression and causal inference, though well-explained, might be too introductory for readers seeking deeper methodological insights or engagement with contemporary debates in statistics and data science.
- Reliance on Established Examples: The book’s examples, while illustrative, sometimes lean on classical or well-worn cases, potentially missing opportunities to explore cutting-edge applications or controversies in big data, machine learning bias, or algorithmic accountability in greater depth.
- Competing Perspectives on Statistical Literacy: Some scholars argue that statistical literacy alone cannot fully counteract misinformation or cognitive biases, emphasizing the role of education in critical thinking more broadly, including media literacy and epistemology.
- Real-World Complexity: The book’s optimistic framing of statistics as a tool for truth and rationality may understate how political, social, and institutional factors often distort data collection, interpretation, and use, a concern highlighted in fields like critical data studies and science and technology studies.
Who Should Read This
Naked Statistics is ideal for intellectually curious readers who seek a foundational yet insightful introduction to statistics without requiring advanced mathematical background. It is particularly valuable for:
- Professionals in business, public policy, healthcare, education, and technology who must interpret data-driven reports and make evidence-based decisions.
- Students and lifelong learners looking to build statistical intuition and critical thinking skills applicable across disciplines.
- Journalists, communicators, and informed citizens who wish to navigate the data-saturated media landscape with greater skepticism and understanding.
- Anyone interested in enhancing their quantitative literacy to better grasp societal debates on issues like climate change, public health, inequality, and technology ethics.
Frequently asked questions about the Naked Statistics book summary
What is Naked Statistics about?
Naked Statistics by Charles Wheelan is a practical guide to statistical thinking that teaches readers how data shapes decisions in modern life—from healthcare to politics to personal finance. The book demystifies statistical concepts like averages, correlation, regression, and probability, showing how they work in real-world applications and how to spot manipulation.
Who should read Naked Statistics?
Anyone who wants to make better decisions and avoid manipulation through data should read Naked Statistics. It's ideal for business professionals analyzing metrics, voters interpreting polls, consumers evaluating health claims, and engaged citizens navigating public debates. No advanced math background is required.
What are the main takeaways from Naked Statistics?
The main takeaways include: averages hide as much as they reveal; correlation never proves causation; data quality determines credibility; probability and uncertainty are unavoidable in real decisions; and statistical literacy is essential for avoiding manipulation. Wheelan emphasizes that statistical thinking is a habit of healthy skepticism, not just a set of calculations.
How does Naked Statistics explain correlation and causation?
Wheelan uses memorable examples like cheese consumption correlating with bedsheet deaths and Nicolas Cage movie releases aligning with pool drownings to show that correlation signals only a pattern, not a cause. He teaches readers to interrogate confounding variables, reverse causality, and selection bias before assuming one thing causes another.
Does Naked Statistics require math skills?
No, Naked Statistics requires no advanced math skills. Wheelan focuses on statistical thinking and intuition rather than formulas, using accessible examples from sports, healthcare, politics, and everyday life to illustrate concepts like averages, distributions, probability, and regression.
What real-world examples does Naked Statistics use?
The book draws on examples including the 2008 financial crisis (credit rating failures), the Flint water contamination scandal (data misreporting), the Mars Climate Orbiter disaster (unit conversion error), medical trials, election polling errors, and sports analytics. These cases show how statistical mistakes have real consequences.
How can I use Naked Statistics to spot manipulation?
Wheelan teaches you to demand context: check absolute numbers alongside percentages, verify sample sizes and sources, identify truncated axes on graphs, and ask 'compared to what?' before accepting a claim. The book trains you to be skeptical of statistics without a clear source, definition, or qualifying uncertainty.
About Sumizeit
Sumizeit is a profitable Scomy LLC company based in Miami, Florida. Our founders, Clemens Raemy and Weina Scott, are successful entrepreneurs with several exits. Sumizeit is a popular book summary app / micro learning app used by busy professionals and entrepreneurs with over 2,500 non-fiction book summaries and 10,000 podcast summaries in text, audio, visual, podcast, and video format. We also have stellar retention tools to make ideas stick - such as flashcards with spaced repetition, quizzes, streaks, highlighting and notes, daily challenges, riddles, mini-courses, meditation, and more. You won't only learn the idea, but also remember it. Over 90% of our users change their habits with Sumizeit.
Upgrade Now
Want the complete 20-minute summary?
- Full structured summary
- Video Summary
- Podcast Summary
- Audio summary
- Key takeaways
- Exercises
- Quiz
- Highlights and notes
- Ask the book with AI
Here's why readers love Sumizeit
Join thousands of learners getting smarter every day
"Great experience. Detailed summaries. Loved the gamification feature. Makes learning fun. Good customer service. I recommend Sumizeit to anyone. You'll learn a lot."
"I always felt busy but still wanting to keep up with the book discussion in my friend group. This was a great supplement to help me keep reading the books I find fun while keeping up with important books."
"I love this website. Instead of scrolling social media, I find myself learning a lot. I use it everyday. I recommend this app for anyone who is too busy and wants to get up to speed with their favorite books."
Naked Statistics Book Summary PDF
Looking for a Naked Statistics Book Summary PDF you can save and revisit offline? Our Naked Statistics Book Summary PDF captures the book’s core ideas in a clean, printable format — the key frameworks, takeaways, and structure without the fluff. Download the Naked Statistics Book Summary PDF when you want a reference you can annotate, share with your team, or review on the go. Get your Naked Statistics Book Summary PDF from the download page below.
Download Naked Statistics Book Summary PDFPeople also liked these summaries
Readers who explored Naked Statistics often enjoyed these titles next.

Want the complete 20-minute summary?
- Full structured summary
- Video Summary
- Podcast Summary
- Audio summary
- Key takeaways
- Exercises
- Quiz
- Highlights and notes
- Ask the book with AI
Featured Book Titles
Popular Book Summaries at sumizeit, leading book summary app